¶ Portal Overview
This page will explore the different features of the EdgePi Online Portal. If you haven't setup your device with the portal yet, refer to the Online Portal Setup.
¶ Dashboard Features
A quick overview of the modules currently available on the online dashboard.
¶ Analytics
At the top of the page, you can view your device's current analytics. It's helpful to monitor these as you work with your device.

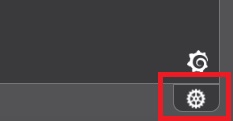
You can manage module settings by clicking the gear icon.
¶ Outputs
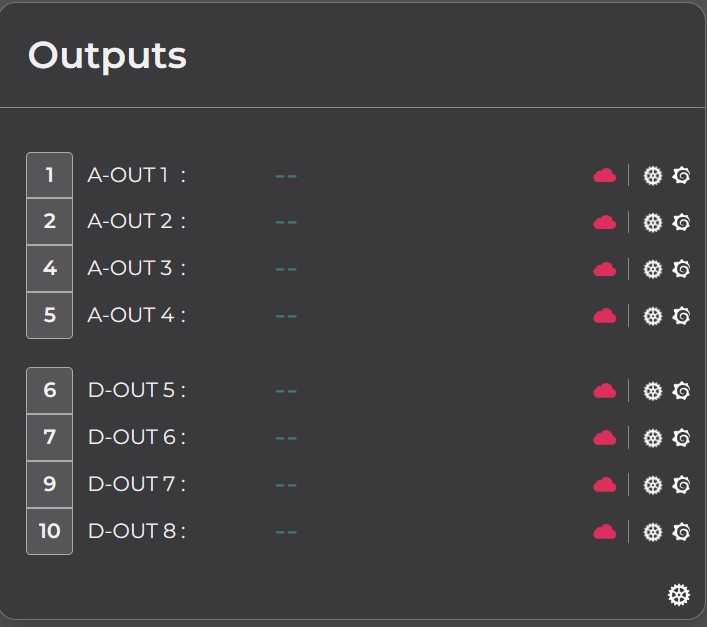
EdgePi features 8 adjustable output modules which can be set to either Analog or Digital.
Analog supports a minimum output of 0 V and a maximum output of 10 V.
Digital supports Hi-Z, Low, and High states.
Access individual channel settings by clicking the gear icon.
![]()
From here, choose the operating mode you'd like.

Access the module settings by clicking the gear icon.
![]()
From here, choose which settings you'd like to change.

¶ Control
Choose whether or not you want Outputs to be controlled by the Dashboard or through the SDK. If you choose SDK, changing Dashboard settings will be disabled.
¶ Inputs
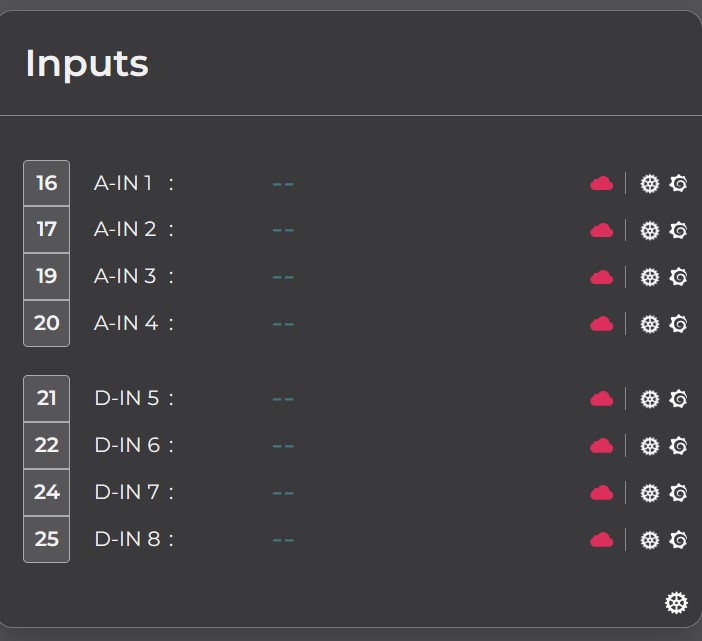
Similarly to Outputs, the EdgePi features 8 input modules for both Analog and Digital.
Analog modules support ADC 1 and ADC 2.
Access individual channel settings by clicking the gear icon.
![]()
From here, choose the operating mode you'd like.

Access the module settings by clicking the gear icon.
![]()
From here, choose which settings you'd like to change.

¶ Control
Choose whether or not you want Inputs to be controlled by the Dashboard or through the SDK. If you choose SDK, changing Dashboard settings will be disabled.
¶ General
¶ Data Collection
Enable/disable data collection for analog inputs.
¶ Data Rate
Set the data collection rate for ADC 1 and ADC 2.
¶ Read Interval
Choose how often the data is read and updated.
¶ RTD
RTD automatically takes over channels 21, 24, and 25, with channel 22 being disabled.
¶ Data Collection
Enable/disable data collection for RTD analog inputs.
¶ ADC
RTD can only be read from ADC 2. This setting cannot be changed.
¶ Cloud Storage
Choose if your data is stored on the cloud.
¶ Differentials
Choose between differentials 1, 2, 3, and 4.
Enable/disable each differential individually.
- DIFF 1: Ports 16, 17.
- DIFF 2: Ports 19, 20.
- DIFF 3: Ports 21, 22.
- DIFF 4: Ports 24, 25.
¶ ADC
Choose between ADC 1 and ADC 2 per differential.
¶ Cloud Storage
Choose if your data is stored on the cloud.
¶ LED's
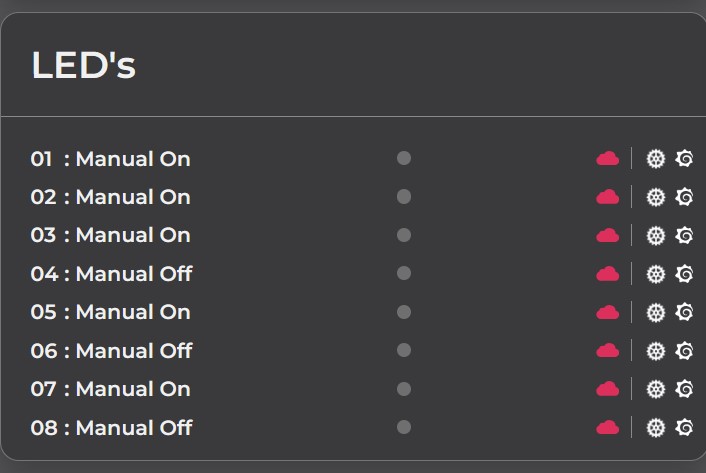
You may have noticed the 8 LEDs on the front plate of the EdgePi. On the Dashboard, you have manual control over each LED.
Access individual channel settings by clicking the gear icon.
![]()
From here, choose the operating mode of the LED.

¶ Thermocouple
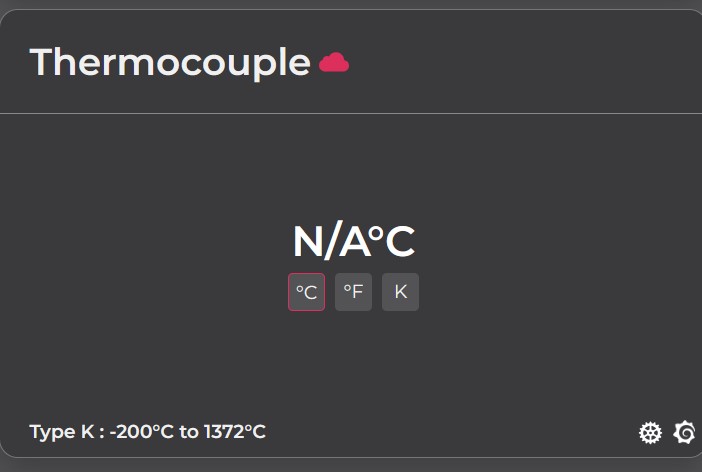
The thermocouple module supports a variety of different types of thermocouples for different applications.
Change the unit of measurement directly on the module.
Access more module settings by clicking the gear icon.
![]()
¶ Data Collection
Enable/disable data collection for your thermocouple.
¶ Cloud Storage
Choose if your data is stored on the cloud.
¶ Type
Choose the type of Thermocouple you're using.
List of Supported Thermocouples
¶ Sample per Average
Choose how many samples are taken for an average measurement.
¶ Read Interval
Choose how often the data is read and updated.
¶ Relay
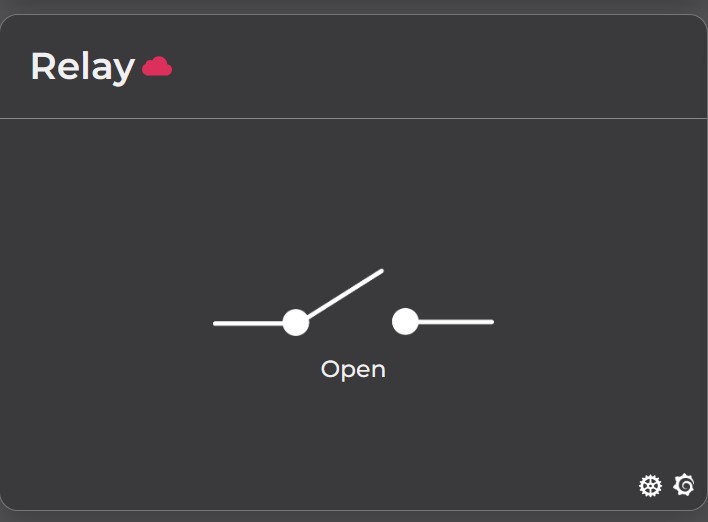
Manage the Relay on your device.
Access the module settings by clicking the gear icon.
![]()
¶ Graphs
EdgePi Portal uses Grafana to easily monitor data. Graphs can be viewed by clicking the Grafana icon next to your module channels or by clicking View Graphs at the top of the page.
![]()
Sign-in to your account by clicking Sign in with OAuth.
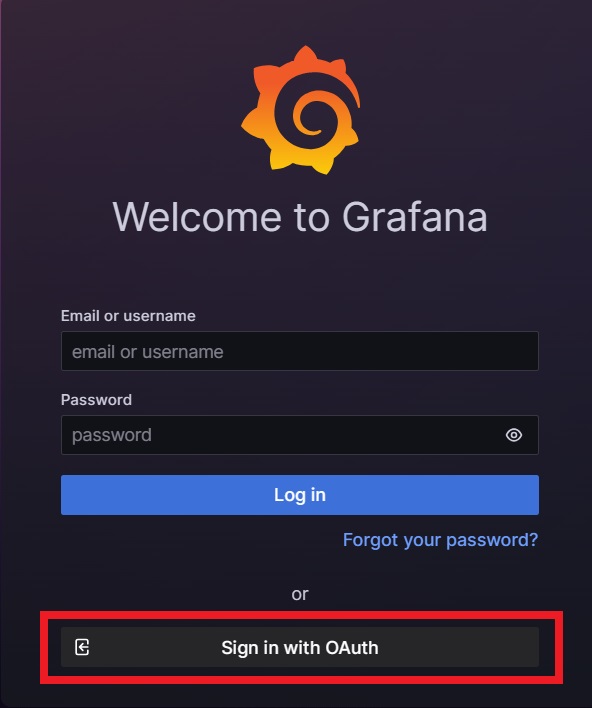
From there, you should be able to sign-in as you did when you first entered the Portal.
¶ Devices
The devices tab allows you to view your added devices.
¶ Orders
The orders tab can be used to view your orders after they have been placed. You can test this feature by purchasing a new device here.
¶ Plans
The plans tab can view your active device plans.